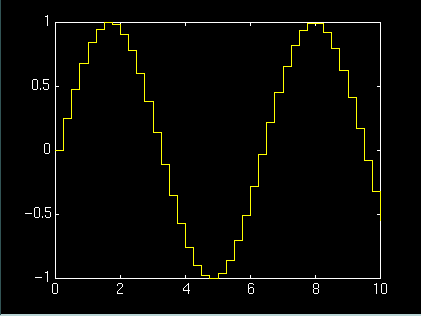
x = 0:.25:10;
stairs(x,sin(x))

stairs(y);stairs(x,y);[xb,yb] = stairs(y)[xb,yb] = stairs(x,y)
stairs(y) draws a stairstep graph of the elements of vector y. A stairstep graph is similar to a bar graph, but the vertical lines dropping to the x-axis are omitted. Stairstep plots are useful for drawing time history plots of digital sampled data systems.
stairs(x,y) draws a stairstep graph of the elements in vector y at the locations specified in vector x. The values in x must be evenly spaced in ascending order.
[xb,yb] = stairs(y) and [xb,yb] = stairs(x,y) do not draw graphs, but return vectors xb and yb such that plot(xb,yb) plots the stairstep graph.
x = 0:.25:10;stairs(x,sin(x))
bar,hist


(c) Copyright 1994 by The MathWorks, Inc.