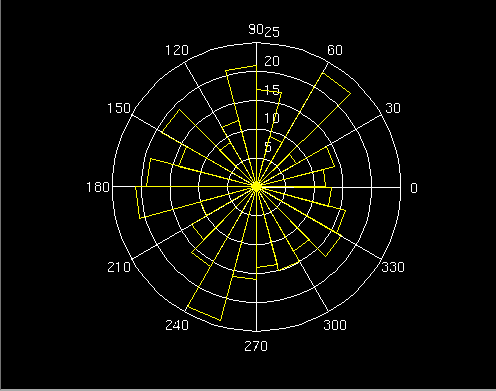
wind = 360*rand(365,1)
rose(wind*pi/180,24)  %histogram every 15 degrees

rose(theta)rose(theta,n)rose(theta,x)[t,r] = rose(...)
rose(theta) plots an angle histogram for the angles in theta, which must be in radians. The angle histogram is a plot in polar coordinates of the number of theta points or samples within each of 20 angle bins.
rose(theta,n) where n is a scalar, uses n equally spaced bins in the range [0, 2*pi].
rose(theta,x) where x is a vector, uses the bins specified in x. The values in x specify the center angle of each bin.
[t,r] = rose(...) returns the vectors t and r such that polar(t,r) is the histogram for the data. No plot is drawn.
wind = 360*rand(365,1)rose(wind*pi/180,24) %histogram every 15 degrees
compass,feather,hist,polar


(c) Copyright 1994 by The MathWorks, Inc.