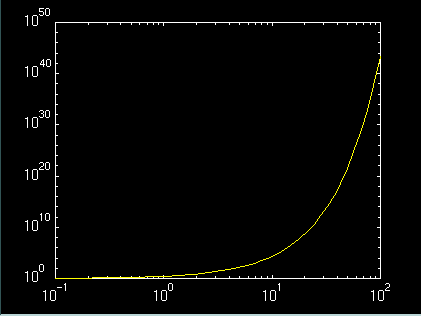
x = logspace(-1,2);
loglog(x,exp(x))

loglog(x,y)loglog(x,y,'linetype')loglog(x1,y1,'linetype1',x2,y2,'linetype2',...)
loglog(...) is the same as plot(...) except logarithmic scales are used for both the x- and y-axes (log-log scales). See plot for information on parameters and options.
loglog plot:
x = logspace(-1,2);loglog(x,exp(x))
plot,semilogx,semilogy


(c) Copyright 1994 by The MathWorks, Inc.