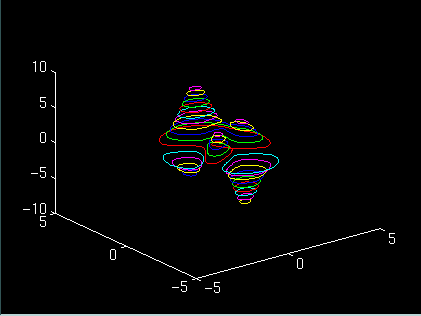
x = -3:.125:3;
y = x;
[X,Y] = meshgrid(x,y);
Z = peaks(X,Y);
contour3(X,Y,Z,20)

contour3(Z)contour3(Z,n)contour3(X,Y,Z)contour3(X,Y,Z,n)C = contour3(...)[C,h] = contour3(...)
contour3 produces a three-dimensional contour plot of a surface defined on a rectangular grid.
contour3(Z) plots the contour lines of Z in three-dimensional format.
contour3(Z,n) plots n contour lines in three-dimensional format.
contour3(X,Y,Z) and contour3(X,Y,Z,n) use matrices X and Y to define the axes limits. X and Y can be vectors too, in which case they are expanded to matrices by replicating rows and columns, respectively.
C = contour3(...) returns the contour matrix C as described in the function contourc and used by clabel.
[C,h] = contour3(...) returns a column vector h of handles to the contour line objects.
peaks function.
x = -3:.125:3;y = x;[X,Y] = meshgrid(x,y);Z = peaks(X,Y);contour3(X,Y,Z,20)
contour3 assumes that vectors x and y are montonically increasing. If x and y are irregularly spaced, the contours are simply stretched apart, which is not the same as contouring the irregularly spaced data.
contour,meshc,meshgrid,surfc


(c) Copyright 1994 by The MathWorks, Inc.