Results page of:
Results page of:
Contents:
Further examples and comparisons
New: insanly large uniform distribution containing 1,835,007 points: points / image (suggested use: bedroom wall paper)
Clips
[click on the icons to watch the videos]
![]()
Clip shows the multi-scale scheme operating and the low-frequency anulus growing as we refine the point set.
The relaxation achieved for the low frequencies at the coarse scales is preserved when refining the poitn set to the next scale where the upper frequency band is relaxed (and hence the anulus grows).
![]()
Clip shows the points and kernels being stochastically relaxed in a spatially-varying target density scenario.
![]()
Clip shows how large points are relaxed only at the coarser scales and remain static at the finer levels while the rest of the points relax.
Spectral comparison
[click to enlarge]

[click to enlarge]
Temperature comparison
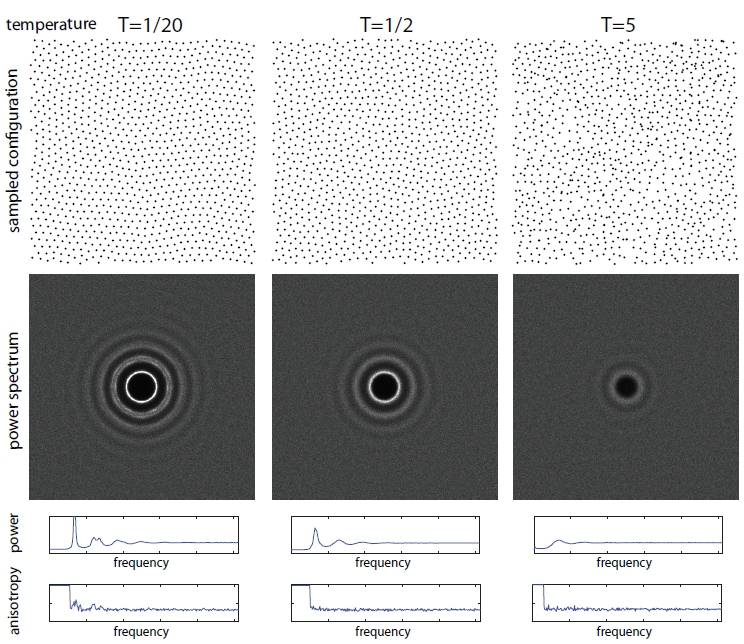
[download uniform patterns at various T values]
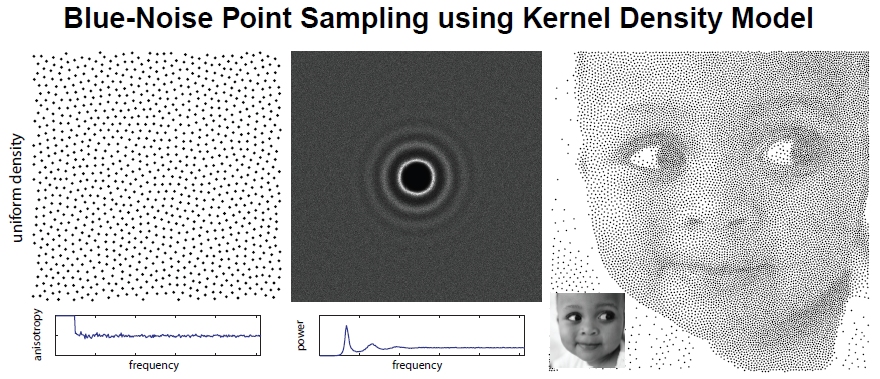
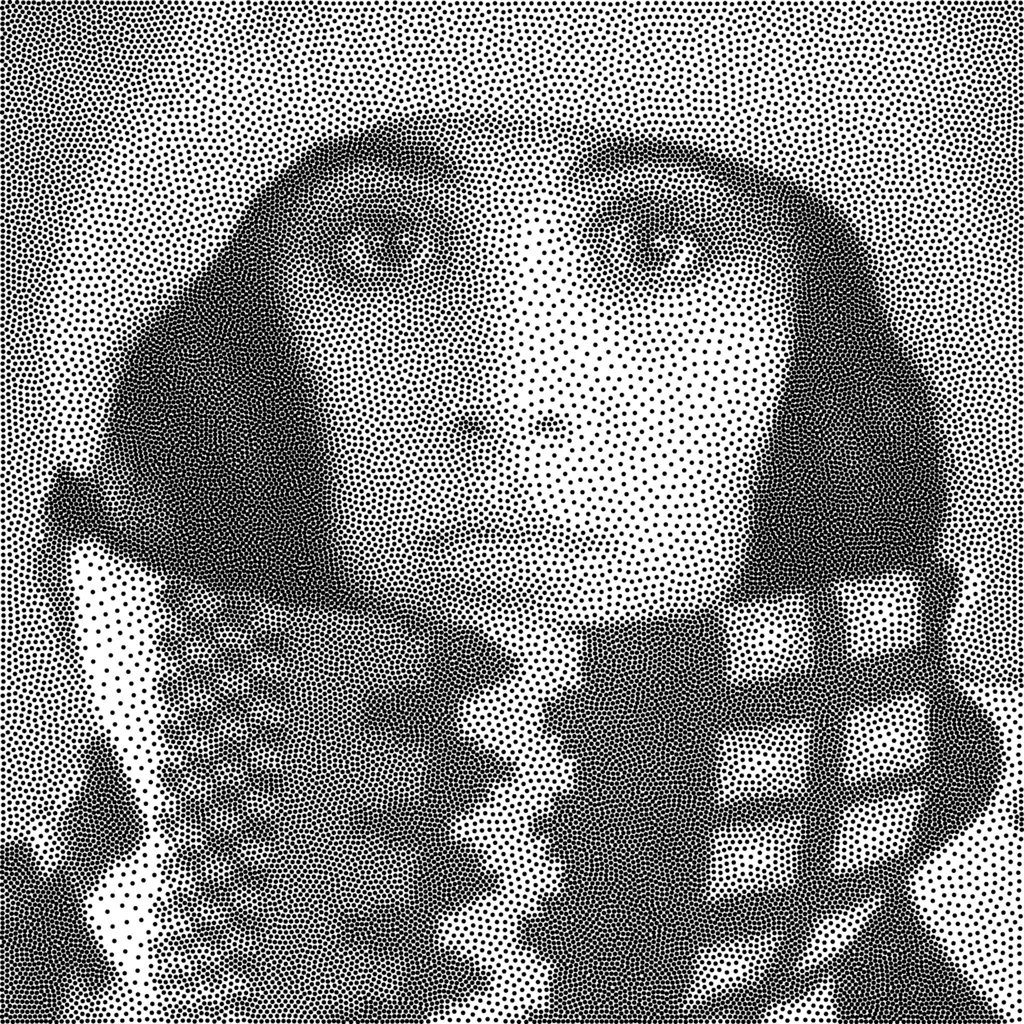
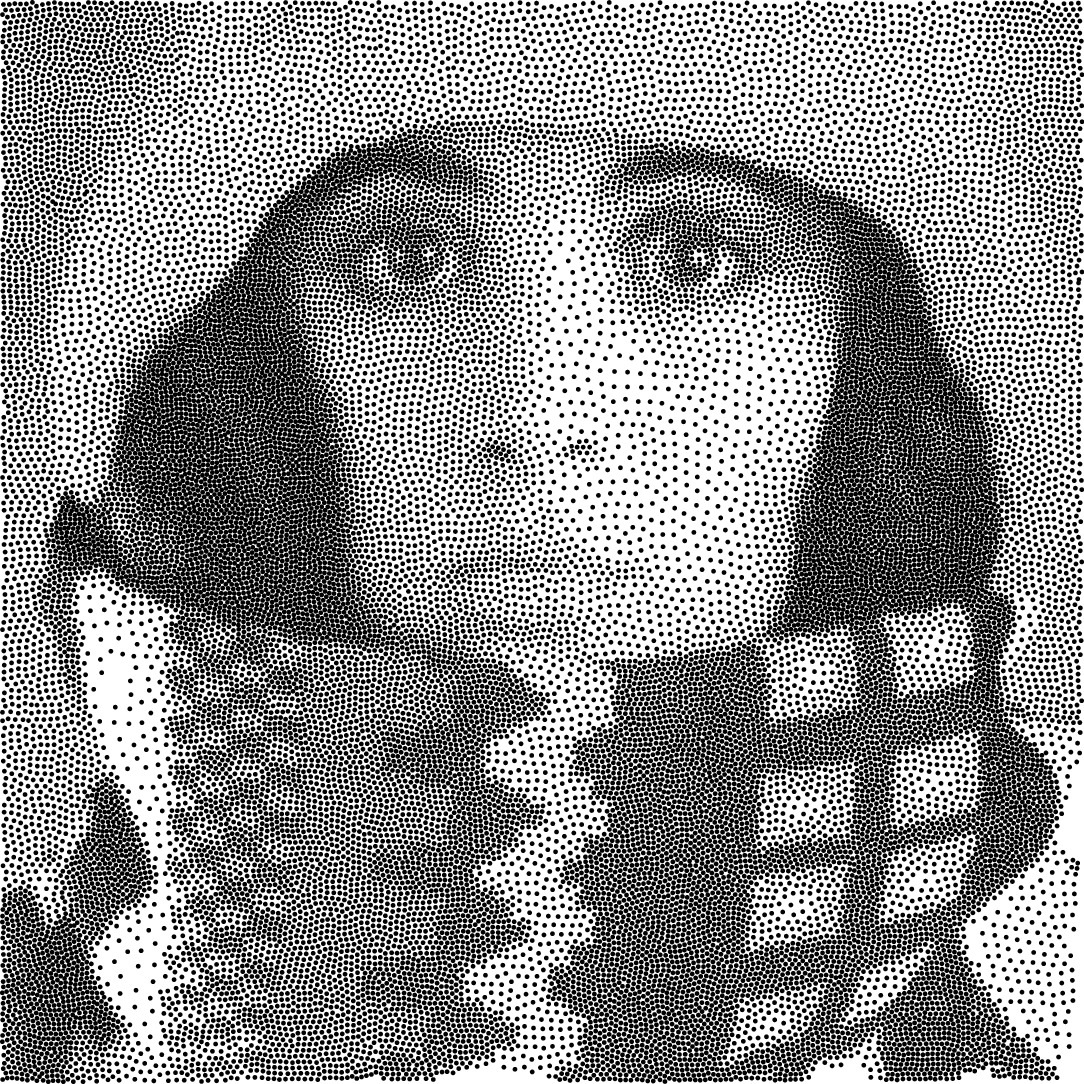
Stipple Drawing

original
Secord [2002]
Balzer et al. [2009]
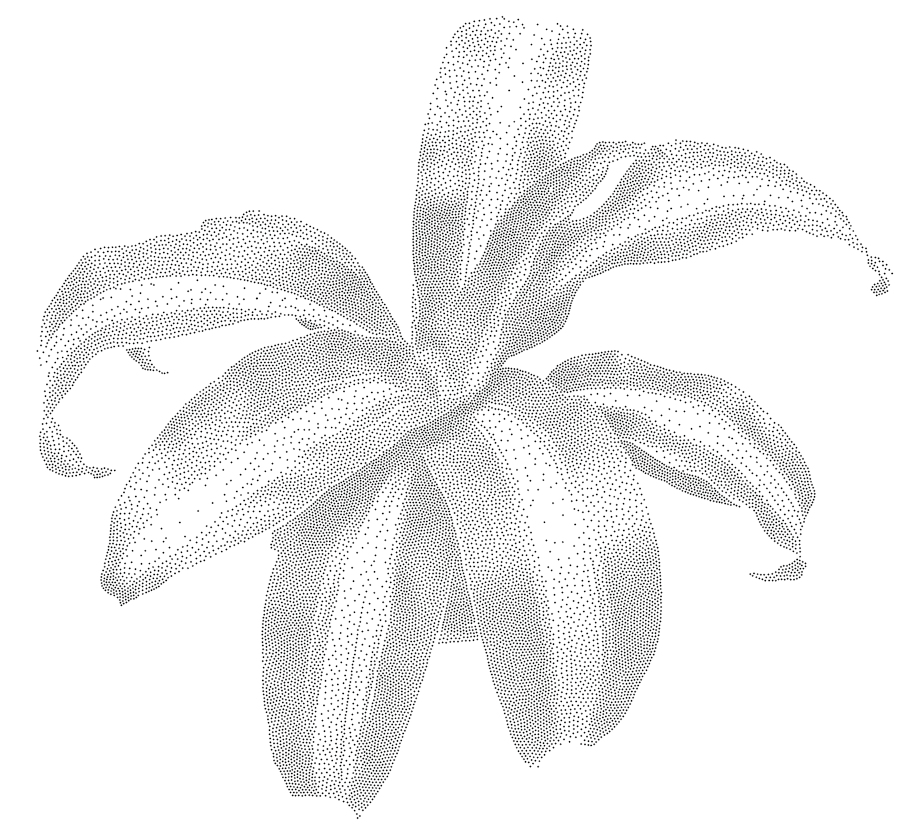
our [eps]
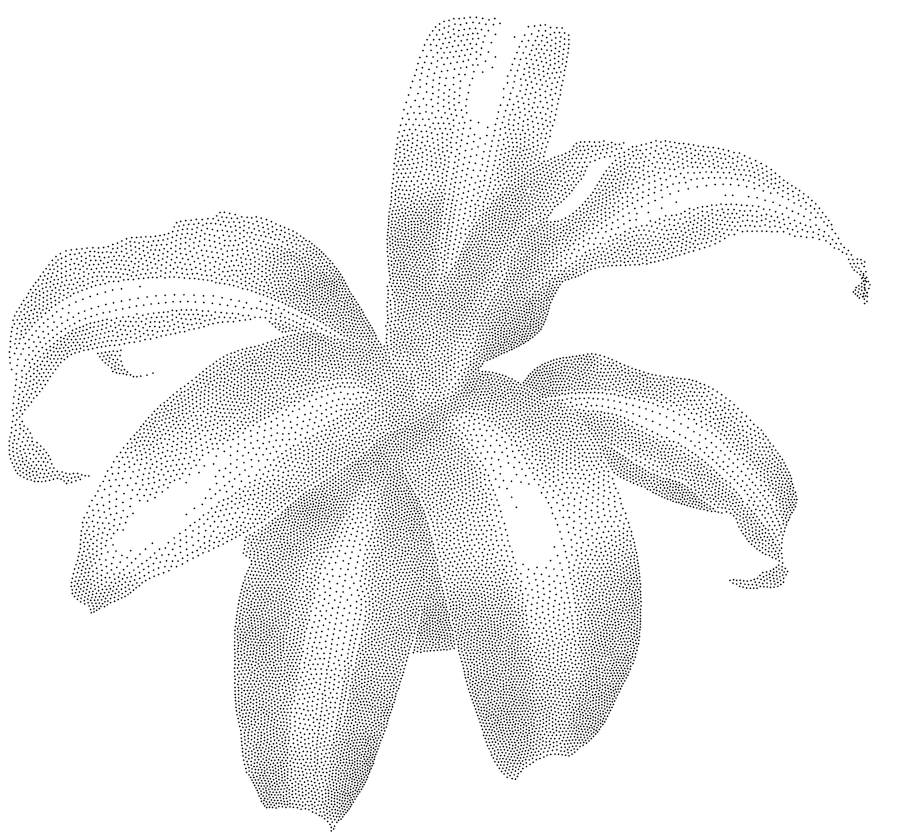
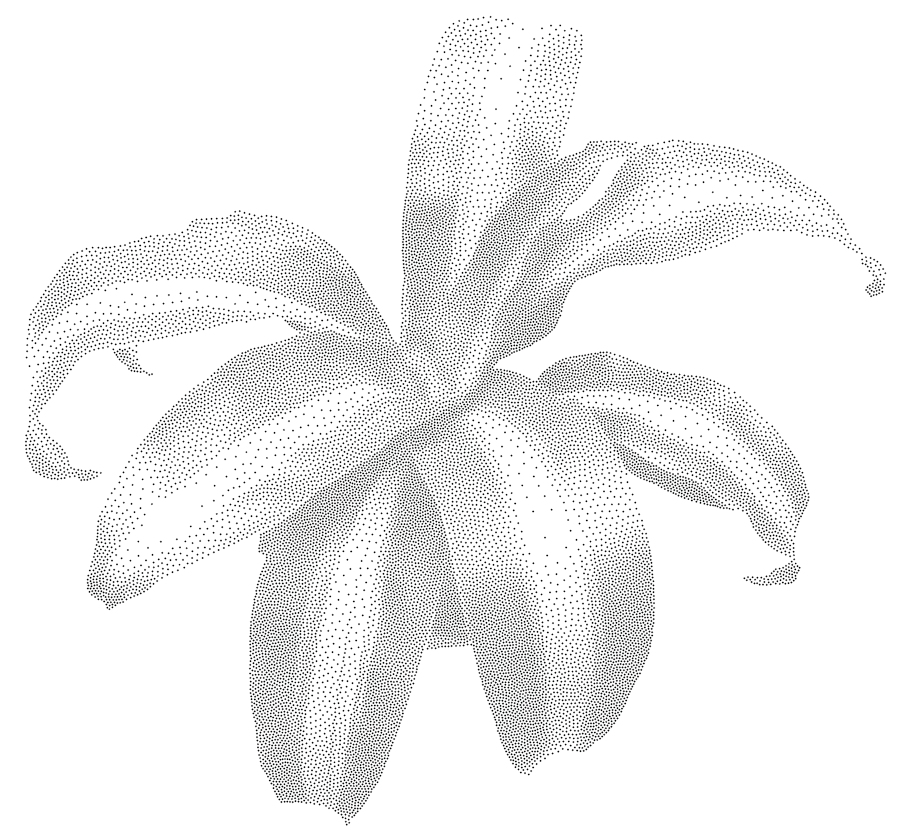
Further examples


Mario [eps]
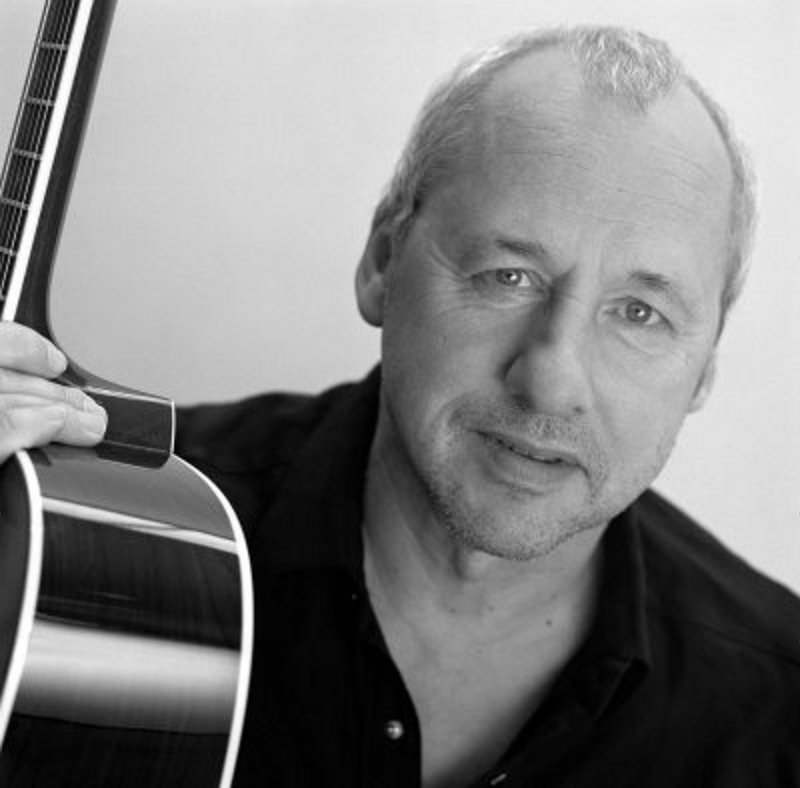
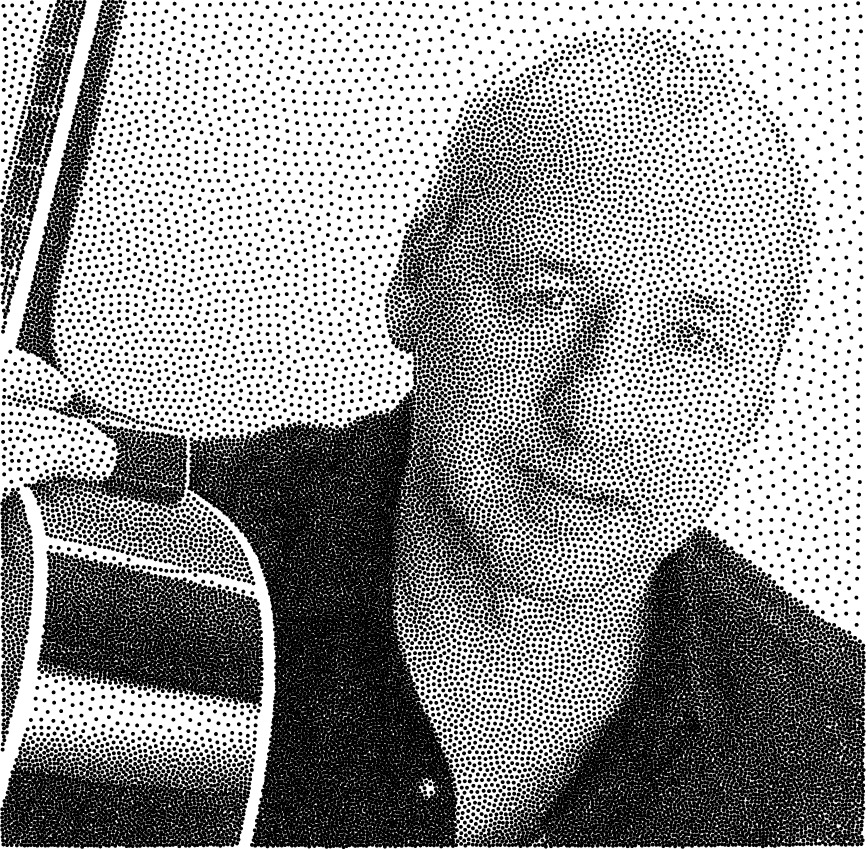
Mark Knopfler [eps]


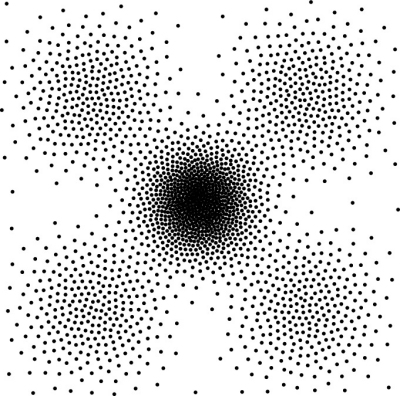
(left to right) input target density, result by Balzer et al. [2009], and our result
density function
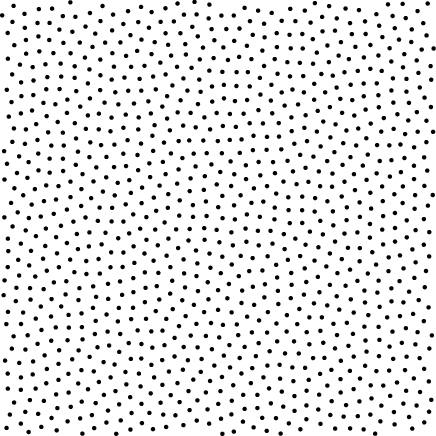
uniform distribution
Comparison: methods & temperatures

input
 |
 |
 |
Schmaltz et al. [2010] |
Schmaltz et al. [2010], jittered |
Balzer et al. [2009] |
 |
 |
 |
our, T=1/100 |
our, T=1/4 |
our, T=1/2 |
click on images to obtain full resolution